What’s the Goal Here?
Imagine this, you’re about to launch a Kickstarter campaign. You’ve got an idea, you’re pumped, but let’s be real, you don’t want to launch blind. That’s where I come in. As the go-to data analyst, my job was to dissect real Kickstarter data and pinpoint what actually moves the needle on campaign success. Spoiler: Not all campaigns are created equal, and there are clear patterns in what wins and what flops.
The data was sourced from a Kaggle dataset containing various fields relevant to Kickstarter projects.
Alright, let’s talk about what a solid marketing strategy looks like for a fitness app designed specifically for women—helping them optimize their workouts by syncing with their hormonal health and menstrual cycle.We’re not just throwing content out there and hoping for the best. This marketing strategy is built on five key pillars: The Who, The What, The Where, The How, and The Packaging.
The Kickstarter project SQL files are available here.
Alright, let’s talk about what a solid marketing strategy looks like for a fitness app designed specifically for women—helping them optimize their workouts by syncing with their hormonal health and menstrual cycle.We’re not just throwing content out there and hoping for the best. This marketing strategy is built on five key pillars: The Who, The What, The Where, The How, and The Packaging.
Cleaning Up the Mess
Before we dive into the juicy insights, we had to clean the house. Raw data can be a nightmare if you don’t whip it into shape first. Here’s how I made it usable:
Cleaning Up the Mess
Before we dive into the juicy insights, we had to clean the house. Raw data can be a nightmare if you don’t whip it into shape first. Here’s how I made it usable:
Cleaning Up the Mess
Before we dive into the juicy insights, we had to clean the house. Raw data can be a nightmare if you don’t whip it into shape first. Here’s how I made it usable:
Cleaning Up the Mess
Before we dive into the juicy insights, we had to clean the house. Raw data can be a nightmare if you don’t whip it into shape first. Here’s how I made it usable:
1.
Table Duplication:
1.
Table Duplication:
1.
Table Duplication:
1.
Table Duplication:
1.
Made a working copy because we do not mess with the original data.
1.
Made a working copy because we do not mess with the original data.
1.
Made a working copy because we do not mess with the original data.
1.
Made a working copy because we do not mess with the original data.
2.
Duplicate Removal:
2.
Duplicate Removal:
2.
Duplicate Removal:
2.
Duplicate Removal:
1.
No one needs redundant data clogging up the results.
1.
No one needs redundant data clogging up the results.
1.
No one needs redundant data clogging up the results.
1.
No one needs redundant data clogging up the results.
3.
Standardization:
3.
Standardization:
3.
Standardization:
3.
Standardization:
1.
Dates should be dates, currency should be consistent, and random time info? Tossed.
1.
Dates should be dates, currency should be consistent, and random time info? Tossed.
1.
Dates should be dates, currency should be consistent, and random time info? Tossed.
1.
Dates should be dates, currency should be consistent, and random time info? Tossed.
4.
Null Handling:
4.
Null Handling:
4.
Null Handling:
4.
Null Handling:
1.
Null fields mean unreliable insights. Cleaned those up so nothing sneaky threw off our analysis.
1.
Null fields mean unreliable insights. Cleaned those up so nothing sneaky threw off our analysis.
1.
Null fields mean unreliable insights. Cleaned those up so nothing sneaky threw off our analysis.
1.
Null fields mean unreliable insights. Cleaned those up so nothing sneaky threw off our analysis.
The Data Deep-Dive
The Data Deep-Dive
The Data Deep-Dive
1. Who’s Making the Big Bucks? (Top 10 by Pledged Amount)
What I found is, technology, design and food projects dominate. If you’re thinking of launching in one of these spaces, good news, you’re in a high-potential category. But fair warning, high competition means you’ll need a killer pitch.
1. Who’s Making the Big Bucks? (Top 10 by Pledged Amount)
What I found is, technology, design and food projects dominate. If you’re thinking of launching in one of these spaces, good news, you’re in a high-potential category. But fair warning, high competition means you’ll need a killer pitch.
1. Who’s Making the Big Bucks? (Top 10 by Pledged Amount)
What I found is, technology, design and food projects dominate. If you’re thinking of launching in one of these spaces, good news, you’re in a high-potential category. But fair warning, high competition means you’ll need a killer pitch.
1. Who’s Making the Big Bucks? (Top 10 by Pledged Amount)
What I found is, technology, design and food projects dominate. If you’re thinking of launching in one of these spaces, good news, you’re in a high-potential category. But fair warning, high competition means you’ll need a killer pitch.
-- Top 10 successful projects with most amount of money pledged.

SELECT `name`, main_category, goal_usd, pledged_usd
FROM ks_prj
WHERE state = 'successful'
ORDER BY pledged_usd DESC
LIMIT 10

2. Who’s Getting the Most Love? (Top 10 by Number of Backers)
Same top categories tech, design, and food. Translation: These categories don’t just attract money; they attract people who are ready to spend. If your project falls outside of these, you’ll need a next-level marketing strategy.
2. Who’s Getting the Most Love? (Top 10 by Number of Backers)
Same top categories tech, design, and food. Translation: These categories don’t just attract money; they attract people who are ready to spend. If your project falls outside of these, you’ll need a next-level marketing strategy.
2. Who’s Getting the Most Love? (Top 10 by Number of Backers)
Same top categories tech, design, and food. Translation: These categories don’t just attract money; they attract people who are ready to spend. If your project falls outside of these, you’ll need a next-level marketing strategy.
2. Who’s Getting the Most Love? (Top 10 by Number of Backers)
Same top categories tech, design, and food. Translation: These categories don’t just attract money; they attract people who are ready to spend. If your project falls outside of these, you’ll need a next-level marketing strategy.
-- Top 10 successful projects with most amount of backers.

SELECT `name`, main_category, backers
FROM ks_prj
WHERE state = 'successful'
ORDER BY backers DESC
LIMIT 10

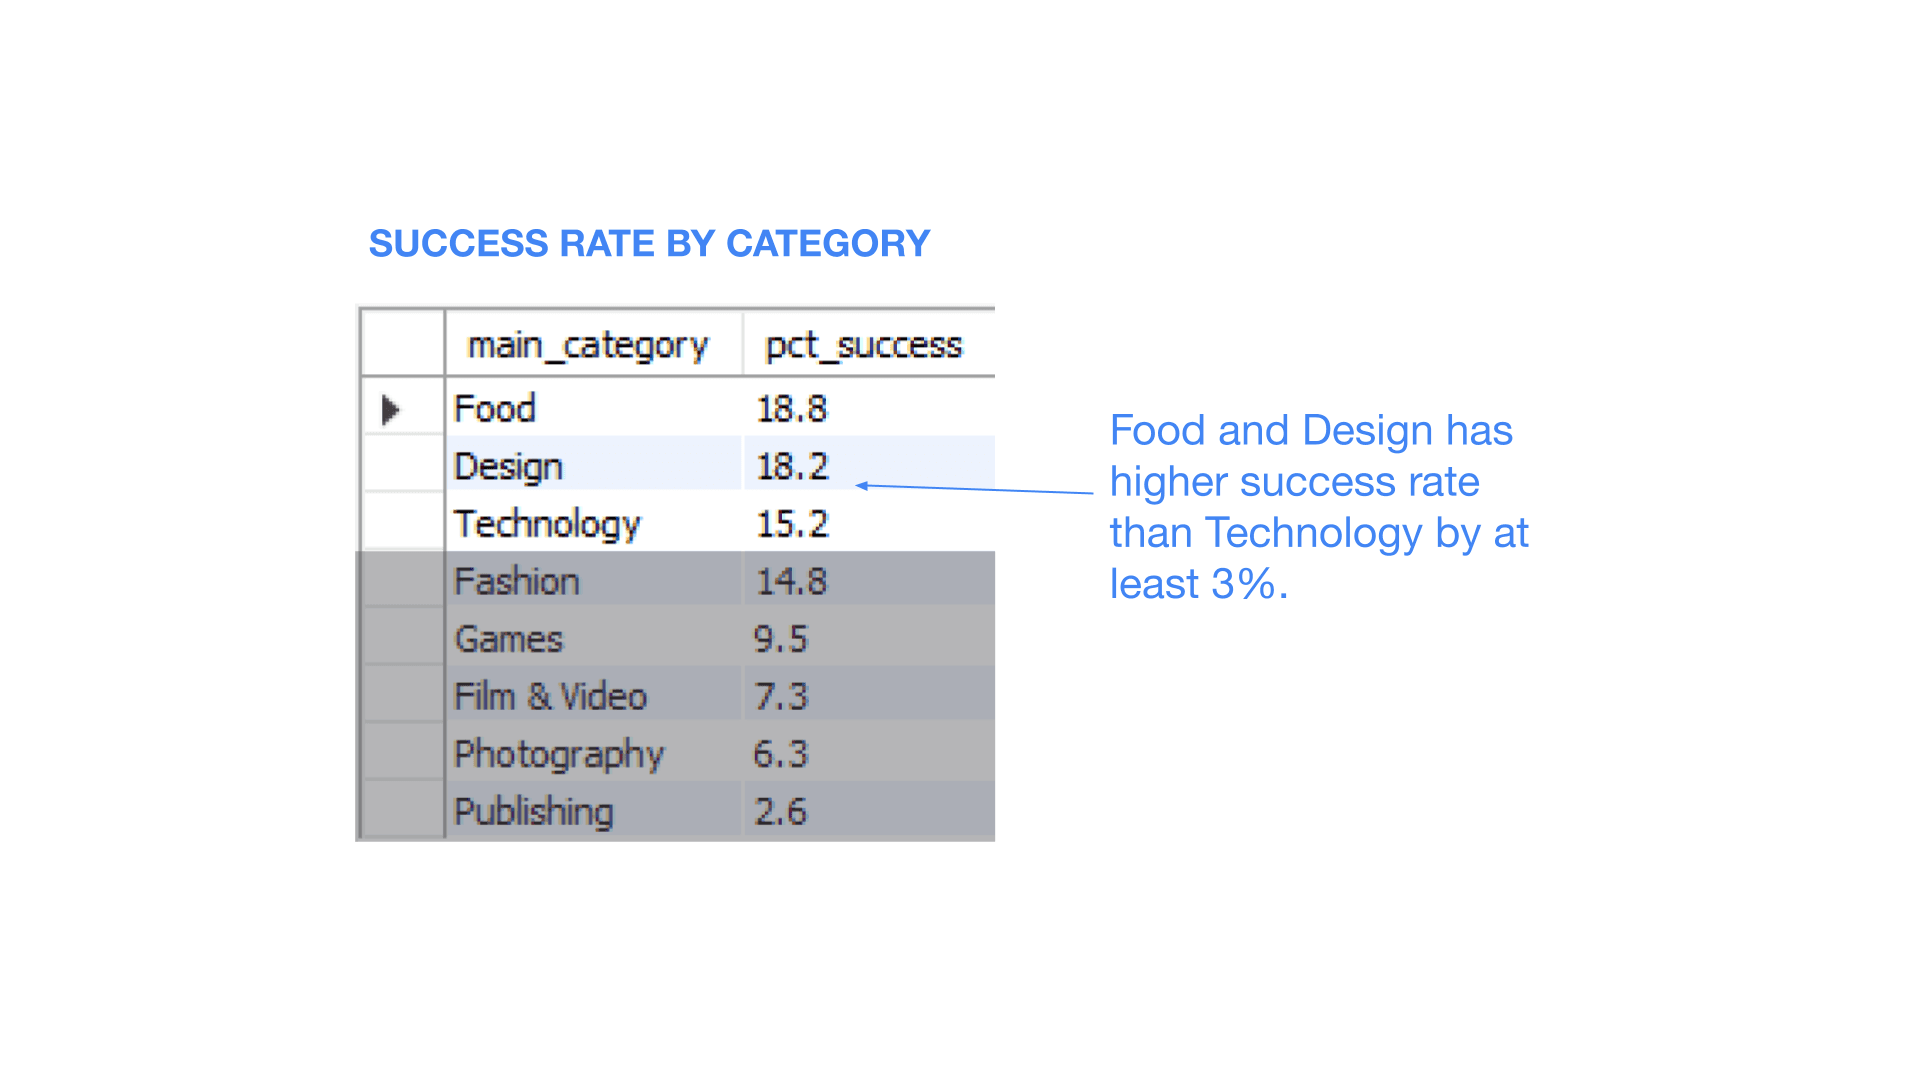
3. What’s the Real Success Rate?
Numbers don’t lie. I filtered for projects with at least 100 backers and $20K pledged to see what categories had the highest success rates. The shocker? Food and design beat technology in success rate by at least 3%. Big takeaway: Just because tech raises the most money doesn’t mean it has the highest win rate
-- Since we are a company, we want to consider a project of at least 100 backers and at least $20,000 pledged.
-- Using CTEs to find the percentage of success of main categories
-- Successful main categories / Total main categories

WITH success_main_cat AS
(
SELECT main_category, COUNT(main_category) AS c_success
FROM ks_prj
WHERE state = 'successful'
AND backers >= 100
AND pledged_usd >= 20000
GROUP BY main_category
),
total AS
(
SELECT main_category, COUNT(main_category) AS c_total
FROM ks_prj
GROUP BY main_category
)
SELECT t.main_category,
ROUND(((smc.c_success/ t.c_total) * 100), 1) AS pct_success
FROM total t
JOIN success_main_cat smc
ON t.main_category = smc.main_category
GROUP BY t.main_category
ORDER BY pct_success DESC
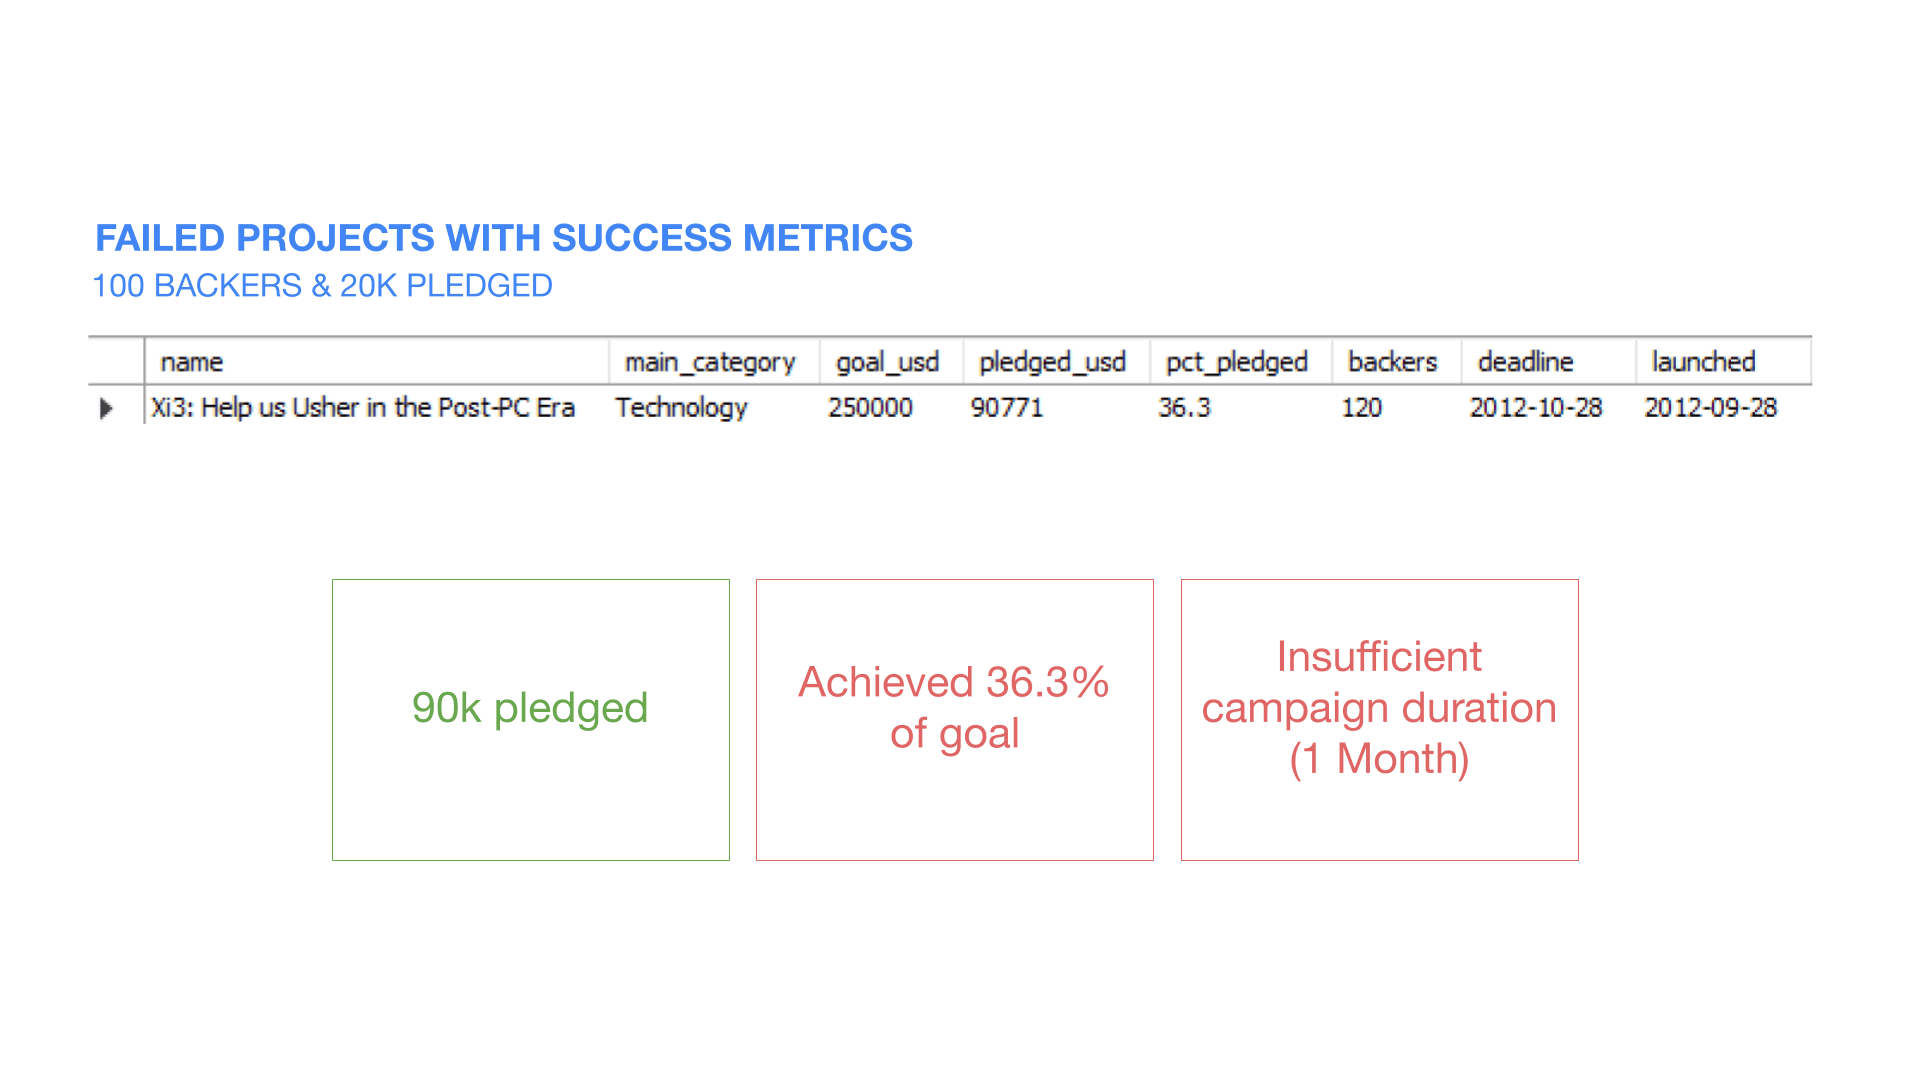
4. Failed Projects That Had Traction
I looked at projects that had decent backing (100+ backers, $20K pledged) but still flopped. There was only one. It raised $90K but only hit 36.3% of its goal. Why? The campaign only lasted one month, not nearly long enough for such a big target. Lesson: Give your campaign time to breathe.
-- Looking at failed projects with at least 100 backers and at least $20,000 pledged and percentage pledged.

SELECT `name`, main_category, goal_usd, pledged_usd,
ROUND((pledged_usd/goal_usd) * 100, 1) AS pct_pledged,
backers, deadline, launched
FROM ks_prj
WHERE state = 'failed'
AND backers >= 100
AND pledged_usd >= 20000
5. What’s “Normal” for a Successful Campaign?
Let’s set realistic expectations. I crunched the numbers to get the averages:
5. What’s “Normal” for a Successful Campaign?
Let’s set realistic expectations. I crunched the numbers to get the averages:
5. What’s “Normal” for a Successful Campaign?
Let’s set realistic expectations. I crunched the numbers to get the averages:
5. What’s “Normal” for a Successful Campaign?
Let’s set realistic expectations. I crunched the numbers to get the averages:
Goal Amount
Goal Amount
Goal Amount
Goal Amount
1.
Know what to ask for.
1.
Know what to ask for.
1.
Know what to ask for.
1.
Know what to ask for.
Pledged Amounts
Pledged Amounts
Pledged Amounts
Pledged Amounts
1.
What’s actually coming in?
1.
What’s actually coming in?
1.
What’s actually coming in?
1.
What’s actually coming in?
Number of Backers
Number of Backers
Number of Backers
Number of Backers
1.
How many people does it take to succeed?
1.
How many people does it take to succeed?
1.
How many people does it take to succeed?
1.
How many people does it take to succeed?
6. How Long Does Success Take?
The average winning campaign takes 4-7 months to hit its target. Rushing the process? Not a great plan. Be patient and strategic.
6. How Long Does Success Take?
The average winning campaign takes 4-7 months to hit its target. Rushing the process? Not a great plan. Be patient and strategic.
6. How Long Does Success Take?
The average winning campaign takes 4-7 months to hit its target. Rushing the process? Not a great plan. Be patient and strategic.
6. How Long Does Success Take?
The average winning campaign takes 4-7 months to hit its target. Rushing the process? Not a great plan. Be patient and strategic.
-- Calculate averages for goal, pledged amounts, backers, pledged per backer with success metrics
-- Amount of time if takes for a project to be successful according to the main categories

WITH prj_size AS
(
SELECT main_category,
ROUND(AVG(goal_usd)) AS avg_goal,
ROUND(AVG(pledged_usd)) AS avg_pledged,
ROUND(AVG(backers)) AS avg_backers,
SUM(pledged_usd) AS pledged_sum,
SUM(backers) AS backers_sum,
SUM(DATEDIFF(deadline, launched)) AS ks_days
FROM ks_prj
WHERE state = 'successful'
AND backers >= 100
AND pledged_usd >= 20000
GROUP BY main_category
)
SELECT main_category, avg_goal, avg_pledged, avg_backers,
ROUND((pledged_sum/backers_sum)) AS pledged_per_backer,
ks_days,
ROUND((ks_days/365) * 12) AS ks_months
FROM prj_size
GROUP BY main_category
ORDER BY avg_pledged DESC

What’s Next? The Game Plan
Knowing all this is cool, but what do we do with it? Here’s the action plan:
What’s Next? The Game Plan
Knowing all this is cool, but what do we do with it? Here’s the action plan:
What’s Next? The Game Plan
Knowing all this is cool, but what do we do with it? Here’s the action plan:
What’s Next? The Game Plan
Knowing all this is cool, but what do we do with it? Here’s the action plan:
1.
Learn from the Best
1.
Learn from the Best
1.
Learn from the Best
1.
Learn from the Best
1.
Dig into the top 10 successful projects. What made them stand out? Let’s steal (ethically) their best practices.
1.
Dig into the top 10 successful projects. What made them stand out? Let’s steal (ethically) their best practices.
1.
Dig into the top 10 successful projects. What made them stand out? Let’s steal (ethically) their best practices.
1.
Dig into the top 10 successful projects. What made them stand out? Let’s steal (ethically) their best practices.
2.
Go Deeper into Niches
2.
Go Deeper into Niches
2.
Go Deeper into Niches
2.
Go Deeper into Niches
1.
Just because “tech” is big doesn’t mean all tech projects win. We need to get more granular. What subcategories are really crushing it?
1.
Just because “tech” is big doesn’t mean all tech projects win. We need to get more granular. What subcategories are really crushing it?
1.
Just because “tech” is big doesn’t mean all tech projects win. We need to get more granular. What subcategories are really crushing it?
1.
Just because “tech” is big doesn’t mean all tech projects win. We need to get more granular. What subcategories are really crushing it?
3.
Spy on the Market
3.
Spy on the Market
3.
Spy on the Market
3.
Spy on the Market
1.
Scrape real Kickstarter data to find winning marketing strategies, reward structures, and campaign buzzwords that pull in backers.
1.
Scrape real Kickstarter data to find winning marketing strategies, reward structures, and campaign buzzwords that pull in backers.
1.
Scrape real Kickstarter data to find winning marketing strategies, reward structures, and campaign buzzwords that pull in backers.
1.
Scrape real Kickstarter data to find winning marketing strategies, reward structures, and campaign buzzwords that pull in backers.
Final Thoughts
Kickstarter success isn’t magic, it’s data. If you want to maximize your chances, study what works, set realistic goals, and give your campaign enough time to gain momentum. Data-backed decisions = smarter launches.
Final Thoughts
Kickstarter success isn’t magic, it’s data. If you want to maximize your chances, study what works, set realistic goals, and give your campaign enough time to gain momentum. Data-backed decisions = smarter launches.
Final Thoughts
Kickstarter success isn’t magic, it’s data. If you want to maximize your chances, study what works, set realistic goals, and give your campaign enough time to gain momentum. Data-backed decisions = smarter launches.
Final Thoughts
Kickstarter success isn’t magic, it’s data. If you want to maximize your chances, study what works, set realistic goals, and give your campaign enough time to gain momentum. Data-backed decisions = smarter launches.
Need an analyst that has SQL skills to quickly sift through data? Let's chat!
GET IN TOUCH
Need an analyst that has SQL skills to quickly sift through data? Let's chat!
GET IN TOUCH
Need an analyst that has SQL skills to quickly sift through data? Let's chat!
GET IN TOUCH
Need an analyst that has SQL skills to quickly sift through data? Let's chat!
GET IN TOUCH